Overview
某客户使用内核模块实现了一个 1.33ms 的 hrtimer 定时器, 实际测试下来发现定时非常不准,有时候延迟多达 10 多 ms。
根据 hrtimer 的实现原理,怀疑是中断被异常 disable 过长时间所致。
这篇文章记录了调查过程:
首先给出了用于测试的 hrtimer 内核模块;
其次使用 irqsoff tracer 测试 irq disable 的 latency 和 call trace;
然后使用 Event Tracing 进一步验证了 irq disable 的 latency;
最后给出结论:内核 printk 且和 hrtimer 运行在同一个 core 是造成 hrtimer 不准的罪魁祸首。
hrtimer_test kernel module
https://github.com/jgsun/jgsun.github.io/blob/master/doc/patches/0001-hrtimer_test.ko.patch
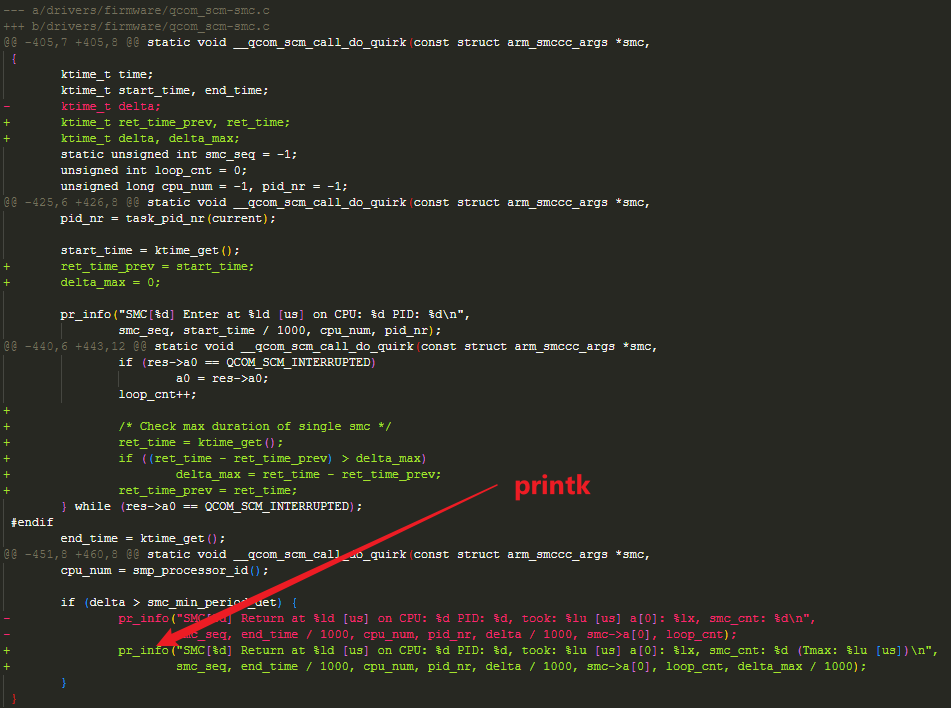
客户为测试 SMC call 的调用时间,在 SMC 内核模块增加了 pr_info 打印,正是这段打印造成了 hrtimer 不准。
Measure irqsoff latency
内核 ftrace 中 irqsoff tracer 用于跟踪中断被禁用的时间:
About irqsoff tracer: When interrupts are disabled, the CPU can not react to any other external event (besides NMIs and SMIs). This prevents the timer interrupt from triggering or the mouse interrupt from letting the kernel know of a new mouse event. The result is a latency with the reaction time. The irqsoff tracer tracks the time for which interrupts are disabled. When a new maximum latency is hit, the tracer saves the trace leading up to that latency point so that every time a new maximum is reached, the old saved trace is discarded and the new trace is saved.
加载 hrtimer 测试模块
root@sa81x5:~# taskset -c 6 insmod /data/hrtimer_test.ko

root@sa81x5:~# while true;do CMD="taskset -c 6 qseecom_sample_client -v smplap64 0 1";echo; echo "## Run cmd: 0"; echo $CMD; $CMD; sleep 1; echo; done
qseecom_sample_client 调用的内核模块调用 printk 输出测试结果,将其和 hrtimer 都运行在 core6, 且 1s 周期循环执行。
设置 irqsoff tracer
root@sa81x5:/sys/kernel/debug/tracing# echo 100000 > buffer_size_kb
root@sa81x5:/sys/kernel/debug/tracing# echo irqsoff > current_tracer
root@sa81x5:/sys/kernel/debug/tracing# echo 0 > options/function-trace
root@sa81x5:/sys/kernel/debug/tracing# echo 0 > tracing_max_latency
其中第一步修改 buffer_size_kb 非必须,这里设置的原因是默认值太小,使能 irqsoff 的时候内核报 warning,且测试结果没 call trace;
第二步设置 current_tracer 为irqsoff,如果内核不支持,需要使能相关 config,并重新编译内核;
第三步设置 function-trace 为0,减少其带来的负面影响;
第四步 reset tracing_max_latency 。
注意这里 tracing_on 默认是 1,如果默认是 0,请先设置为 1 使能 ftrace 功能。
查看测试结果
root@sa81x5:/sys/kernel/debug/tracing# cat tracing_max_latency

root@sa81x5:/sys/kernel/debug/tracing# cat trace
# tracer: irqsoff
#
# irqsoff latency trace v1.1.5 on 5.4.161-qgki-debug
# --------------------------------------------------------------------# latency: 7038 us, #4/4, CPU#2 | (M:preempt VP:0, KP:0, SP:0 HP:0 #P:8)
#    -----------------
#    | task: kworker/u16:4-8174 (uid:0 nice:0 policy:0 rt_prio:0)
#    -----------------
#  => started at: vprintk_emit
#  => ended at:   vprintk_emit
#
#
#                    _------=> CPU#
#                   / _-----=> irqs-off
#                  | / _----=> need-resched
#                  || / _---=> hardirq/softirq
#                  ||| / _--=> preempt-depth
#                  |||| /     delay
#  cmd     pid     ||||| time  |   caller
#     \   /        |||||  \    |   /
kworker/-8174      2d..2    0us#: console_trylock_spinning <-vprintk_emit
kworker/-8174      2d..2 7038us : console_trylock_spinning <-vprintk_emit
kworker/-8174      2d..2 7039us : trace_hardirqs_on <-vprintk_emit
kworker/-8174      2d..2 7042us : <stack trace>
 => vprintk_default
 => vprintk_func
 => printk
 => __this_cpu_preempt_check
 => __qcom_scm_call_do_quirk
 => qcom_scm_call_smccc
 => __qcom_scm_dcvs_reset
 => qcom_scm_dcvs_reset
 => tz_handler
 => devfreq_suspend_device
 => do_devfreq_suspend
 => process_one_work
 => worker_thread
 => kthread
 => ret_from_fork
测试结果一目了然,正是所加的测试代码中的 printk 造成 irq 被长时间 disable:
Check irq_disable by Event Tracing
About Event Tracing
https://docs.kernel.org/trace/events.html
加载 hrtimer 测试模块
root@sa81x5:~# taskset -c 6 insmod /data/hrtimer_test.ko

root@sa81x5:~# while true;do CMD="taskset -c 6 qseecom_sample_client -v smplap64 0 1";echo; echo "## Run cmd: 0"; echo $CMD; $CMD; sleep 1; echo; done
qseecom_sample_client 对应的内核模块调用 printk 输出测试结果,将其和 hrtimer 都运行在 core6, 且 1s 周期循环执行。
Enable irq_handler_entry/irq_handler_exit 和 irq_disable/irq_enable Event Tracing
root@sa81x5:/sys/kernel/debug/tracing# echo irq:irq_handler_entry > set_event
root@sa81x5:/sys/kernel/debug/tracing# echo irq:irq_handler_exit >> set_event
root@sa81x5:/sys/kernel/debug/tracing# echo preemptirq:irq_disable >> set_event
root@sa81x5:/sys/kernel/debug/tracing# echo preemptirq:irq_enable >> set_event
使用 trace_pipe 保存结果
jianguos@jianguos-gv:hrtimer$ adb shell cat /sys/kernel/debug/tracing/trace_pipe | grep "\[006\]" > trace_hrtimer_irq.txt &
注意,这里使用 grep 过滤只保存 core6 的 trace 减小文件大小。
后记:根据内核文档 ftrace - Function Tracer,使用 tracing_cpumask 可以更加高效达到目的。
tracing_cpumask:
This is a mask that lets the user only trace on specified CPUs. The format is a hex string representing the CPUs.
另外发现:可以通过 per_cpu/cpu6/trace 或者 per_cpu/cpu6/trace_pipe 来读取,已经帮忙过滤好了,只输出 core6 的 trace log。
per_cpu/cpu0/trace:

This is similar to the “trace” file, but it will only display the data specific for the CPU. If written to, it only clears the specific CPU buffer.

per_cpu/cpu0/trace_pipe

This is similar to the “trace_pipe” file, and is a consuming read, but it will only display (and consume) the data specific for the CPU.
分析
Analysis: In function console_unlock, the local cpu irq is disable for about 10ms, which introduce the hrtimer overruns.
jianguos@jianguos-gv:hrtimer$ tail -f trace_hrtimer_irq.txt | grep6462
           <...>-6462    [006] d..1 14372.732649: irq_disable: caller=console_unlock+0xc0/0x510 parent=vprintk_emit+0x134/0x1d0
           <...>-6462    [006] d..1 14372.743615: irq_enable: caller=console_unlock+0x39c/0x510 parent=vprintk_emit+0x134/0x1d0
           <...>-6462    [006] d..1 14372.743616: irq_disable: caller=el1_irq+0xb4/0x200 parent=console_unlock+0x3a0/0x510
           <...>-6462    [006] d.h1 14372.743617: irq_handler_entry: irq=3 name=arch_timer
           <...>-6462    [006] d.h1 14372.743618: hrtimer_cb: hrtimer stat: now: 14372743560 [us] expect_expires: 14372733903 [us], delta: 9656, next_expires: 14372744570
           <...>-6462    [006] d.h1 14372.743619: hrtimer_cb: 8 overruns
           <...>-6462    [006] d.h1 14372.743625: irq_handler_exit: irq=3 ret=handled
结论
内核 printk 一直是内核社区的热点问题,下面是各种关于 printk 的讨论资料:
The printk saga
Video, LPC2022: The printk saga
Overview over the latest approach to printk and a discussion how to proceed
LWN: A discussion on printk() 由于各种原因,内核的打印函数printk()多年来一直是许多改进工作的目标。printk()的一个持久问题是它的延迟对于实时Linux内核来说是不可接受的高;此时,printk() 代表 RT_PREEMPT 补丁完全合并之前需要更改的最后一块。因此,对于printk()的延迟和许多其他原因,已经做出了努力,但这些都没有进入主线;最近在2022年Linux管道工会议(LPC)上的一场讨论似乎为新的solut铺平了道路。
printk for 5.20 的邮件讨论
[GIT PULL] printk for 5.20 - Petr Mladek (kernel.org)
- Completely disable printing on consoles with CONFIG_RT. They break
  RT guarantees. They are too slow to be called with raw spinlocks.
  They can't be called with normal spinlocks in an atomic context because
  RT spinlocks might sleep. It is going to get fixed by the kthreads and
  atomic consoles. In the meantime, the debugging of CONFIG_RT kernel
  will be possible only by the user space kernel log readers.
Why printk() is so complicated (and how to fix it)
LWN: Why printk() is so complicated (and how to fix it)
Video: LPC2019 - printk: Why is it so complicated? - YouTube
PDF: printk: Why is it so complicated?
printk: kthreads and atomic consoles for mainline
PDF, LPC2021 printk: kthreads and atomic consoles for mainline