- 1. Overview
- 2. DPAA Egress congestion threshold 引起的 OOM
- 3. 不接 SFP+ 模块引起的 OOM
- 4. socket 接收 buf 引起的 OOM
- 5. 蓝牙驱动 bug 导致 oom
- 6. 常用内存工具
1. Overview
此文分析了项目中 OOM 的几个例子。

2. DPAA Egress congestion threshold 引起的 OOM
某网络转发设备, Wigi 收包, 处理后经 DPAA 1G ethernet 发送出去,这样当 Wigi入 口流量超过 1G,DPAA ehternet mac 层就出现拥堵情况,dapp 的驱动可以缓存数据包,有配置参数指定缓存数据包的大小,当设置的太大,就可能导致出口拥堵的时候产生 OOM。这种问题比较难查,因为 meminfo 里面的 slab catch 并没有增加,需要对 DPAA 驱动特别熟悉才能很快找到问题所在。
+# decrease Egress congestion threshold to avoid OOM
+CONFIG_FSL_DPAA_CS_THRESHOLD_1G=0x02000000
+CONFIG_FSL_DPAA_CS_THRESHOLD_10G=0x06000000
3. 不接 SFP+ 模块引起的 OOM
某板卡当前采用用户空间 libsfp 来访问处理器 mac 寄存器和 SFP 模块,如下图所示:
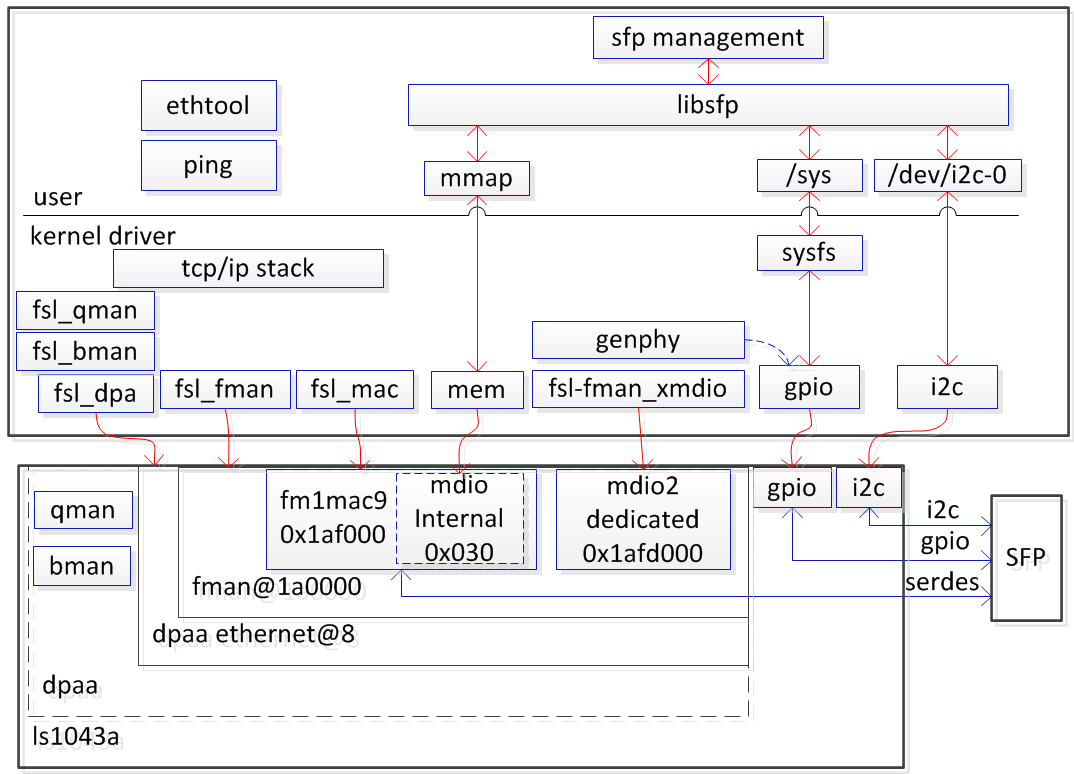
(1)通过 mmap 内存映射方式访问 MA C的内部 mdio 寄存器,进行模式切换等
(2)通过 sysfs 访问 SFP gpio 信号获取在位,使能等状态
(3)通过 i2c 访问 SFP 内部寄存器获取温度,电压等信息
(4)内核 dts 给 mac 指定了外部 phy 属性,即使根本不存在外部 phy
这样内核协议栈不能获取 sfp 的真实状态,网络接口被启用(ifconfig up)之后,link 状态采用的是默认值,没法动态更新,带来两个问题:
(1)无论 sfp 模块在位与否,ethtool 查询其 link 状态都是 on
(2)没有 sfp 模块的情况下,网络接口转发的数据包可以从链路层发送,但是网络 dapp 驱动因为收到发送完成信号而不会去释放 skb 数据缓冲区,导致标题提到的 OOM 问题。slabtop 或者查看 /proc/slabinfo 小时 4096byte 大小的 slab 对象不断增加。
解决方案有三种:
(1)app 通过 libsfp API 检测到 SFP 不在位时,关闭 网络接口(ifconfig down)或者检测到 SFP 在位是才启用网络接口。但是 app 同事以时序等(没理解)理由不同意这样改。(只能解决 OOM 问题,不能解决 ethtool 问题)
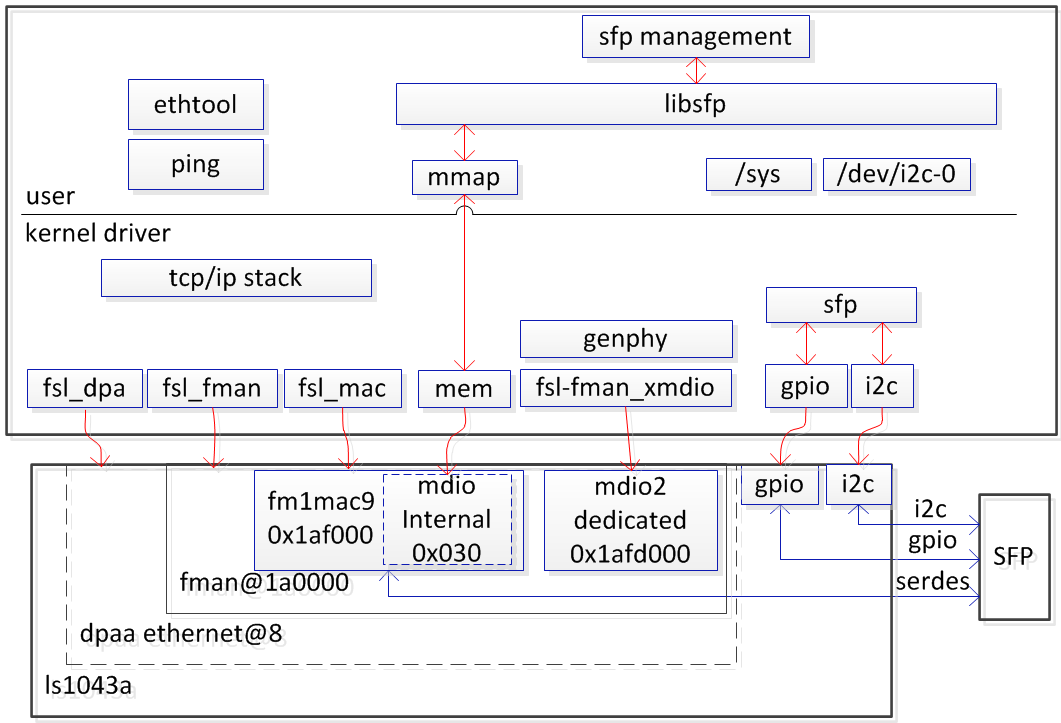
(2)让内核访问 SFP 在位的 GPIO 信号(如上图中的蓝色虚线所示),让 phy_state_machine 状态机读取该信号实时更新 link 状态。(可同时解决 OOM问题和 ethtool 问题,最后采用了这个方案)
(3)移植sfp驱动,Linux 内核 4.14 版本之后的内核集成了 sfp 驱动(Phylink & SFP support)。
对应框图如下:
4. socket 接收 buf 引起的 OOM
调查发现 zebra 创建 ipv6 的 raw socket,默认不接收数据(经命令设置接收),这样数据在 socket 缓存不断堆积引起内存 OOM。
对 socket 的接收/发送缓存,内核提供了两个设置机制:
一是 peocfs 属性文件设置: rmem_default/wmem_default(单位:字节),rmem_max/wmem_max;
二是提供 setsockopt 系统调用设置接收/发送缓存;rmem_default/wmem_default 用来给新创建的 socket 来设定 socket 的初始默认接收/发送缓存,rmem_max/wmem_max 用来限制 setsockopt 系统调用能设置的最大值。
应用根据实际情况来使用这两个机制。现在 zebra 创建了一个 socket,而默认不去接收,也没有调用 setsockopt 去设置缓存而使用默认设置,导致 socket 接收缓存不断增加而使系统奔溃,也不能来说是默认设置不当吧。默认设置要对所有 socket 负责,设置小了导致丢包,设置大了导致内存紧张。(当前系统的 rmem_default 设置为 50000000 字节/50M)应用根据 socket 的实际使用情况来使用内核机制来设置使用缓存,不应该全依赖默认设置。对这个 zebra socket,能不能在创建 socket 的时候调用 setsockopt 去设置一下缓存;或者在开始接收的时候才去创建socket? 最后app修改了 zebra 源码,调用 setsockopt 去设置了缓存。
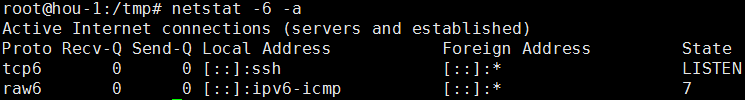
netstat -6 -a 命令查看socket raw6的Recv-Q很大
不启动 app,cat /proc/net/raw6 发现drops不断增加,说明套接字接收缓存在不断溢出。

socket创建流程:
sock = vrf_socket (AF_INET6, SOCK_RAW, IPPROTO_ICMPV6, zvrf->vrf_id);
    sock_create(family, type, protocol, &sock)
        sock = sock_alloc() //分配socket和inode
        pf->create(net, sock, protocol, kern) //调用AF_INET6协议簇套接字创建函数inet6_create
            inet6_create
                sk = sk_alloc(net, PF_INET6, GFP_KERNEL, answer_prot, kern) //分配sock
                sock_init_data(sock, sk)
                    sk->sk_rcvbuf = sysctl_rmem_default //使用rmem_default/wmem_default初始化socket收发缓存
                    sk->sk_sndbuf = sysctl_wmem_default
    sock_map_fd(sock, flags & (O_CLOEXEC | O_NONBLOCK))
5. 蓝牙驱动 bug 导致 oom
使用内核 kmemleak 工具扫描发现蓝牙驱动有引起 OOM 的bug。
[PATCH v2] Bluetooth: Fix memory leak at end of hci requests
net: bluetooth: Fix memory leak at end of
 hci requests

From: Frederic Dalleau <frederic.dalleau@collabora.co.uk>

In hci_req_sync_complete the event skb is referenced in hdev->req_skb.
It is used (via hci_req_run_skb) from either __hci_cmd_sync_ev which will
pass the skb to the caller, or __hci_req_sync which leaks.

unreferenced object 0xffff880005339a00 (size 256):
  comm "kworker/u3:1", pid 1011, jiffies 4294671976 (age 107.389s)
  backtrace:
    [<ffffffff818d89d9>] kmemleak_alloc+0x49/0xa0
    [<ffffffff8116bba8>] kmem_cache_alloc+0x128/0x180
    [<ffffffff8167c1df>] skb_clone+0x4f/0xa0
    [<ffffffff817aa351>] hci_event_packet+0xc1/0x3290
    [<ffffffff8179a57b>] hci_rx_work+0x18b/0x360
    [<ffffffff810692ea>] process_one_work+0x14a/0x440
    [<ffffffff81069623>] worker_thread+0x43/0x4d0
    [<ffffffff8106ead4>] kthread+0xc4/0xe0
    [<ffffffff818dd38f>] ret_from_fork+0x1f/0x40
    [<ffffffffffffffff>] 0xffffffffffffffff
6. 常用内存工具
| Name | Function | Link |
|---|---|---|
| free | Display amount of free and used memory in the system | https://linux.die.net/man/1/free |
| /proc/meminfo | Information about memory usage, both physical and swap. | https://www.kernel.org/doc/Documentation/filesystems/proc.txt |
| /proc/slabinfo | Gives full information about memory usage on the slab level | https://www.kernel.org/doc/Documentation/filesystems/proc.txt |
| /proc/buddyinfo | diagnosing memory fragmentation issues | https://lwn.net/Articles/7868/ |
| /proc/pagetypeinfo | Additional page allocator information | https://www.kernel.org/doc/Documentation/filesystems/proc.txt |
| /proc/PID/status | Process status in human readable form | https://www.kernel.org/doc/Documentation/filesystems/proc.txt |
| slabtop | Displays detailed kernel slab cache information in real time | https://linux.die.net/man/1/slabtop |
| slabinfo | Tool to get reports about slabs | tools/vm/slabinfo.c |
| top | display Linux tasks,including mem info | https://linux.die.net/man/1/top |
| smem | smem is a tool that can give numerous reports on memory usage on Linux systems. | https://www.selenic.com/smem/ |
| valgrind | a suite of tools for debugging and profiling programs | http://www.valgrind.org/docs/manual/index.html https://linux.die.net/man/1/valgrind |
| vmstat | Report virtual memory statistics | https://linux.die.net/man/8/vmstat |
| KASAN | dynamic memory error detector. It provides a fast and comprehensive solution for finding use-after-free and out-of-bounds bugs. | https://www.kernel.org/doc/html/latest/dev-tools/kasan.html |
| Kmemleak | detecting possible kernel memory leaks in a way similar to a tracing garbage collector | https://www.kernel.org/doc/html/latest/dev-tools/kmemleak.html?highlight=kmemleak |